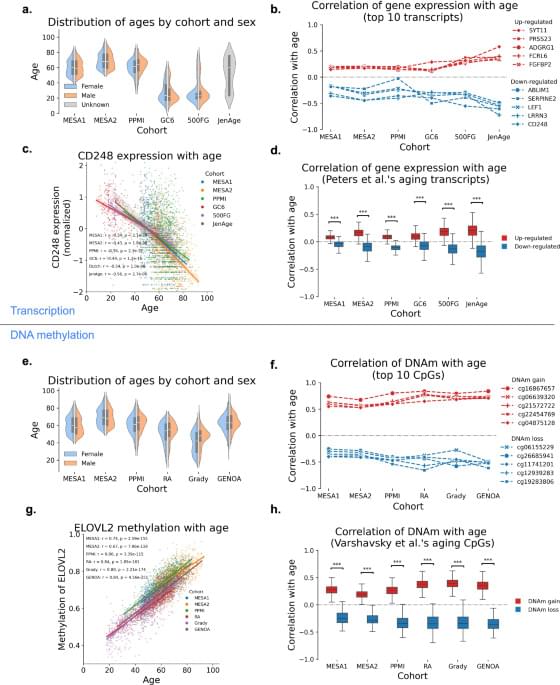
DNA methylation and gene expression data integration identify aging-related genes in blood that predict health outcomes, offering new insights into aging biology and potential therapeutic targets.
Category: genetics – Page 4
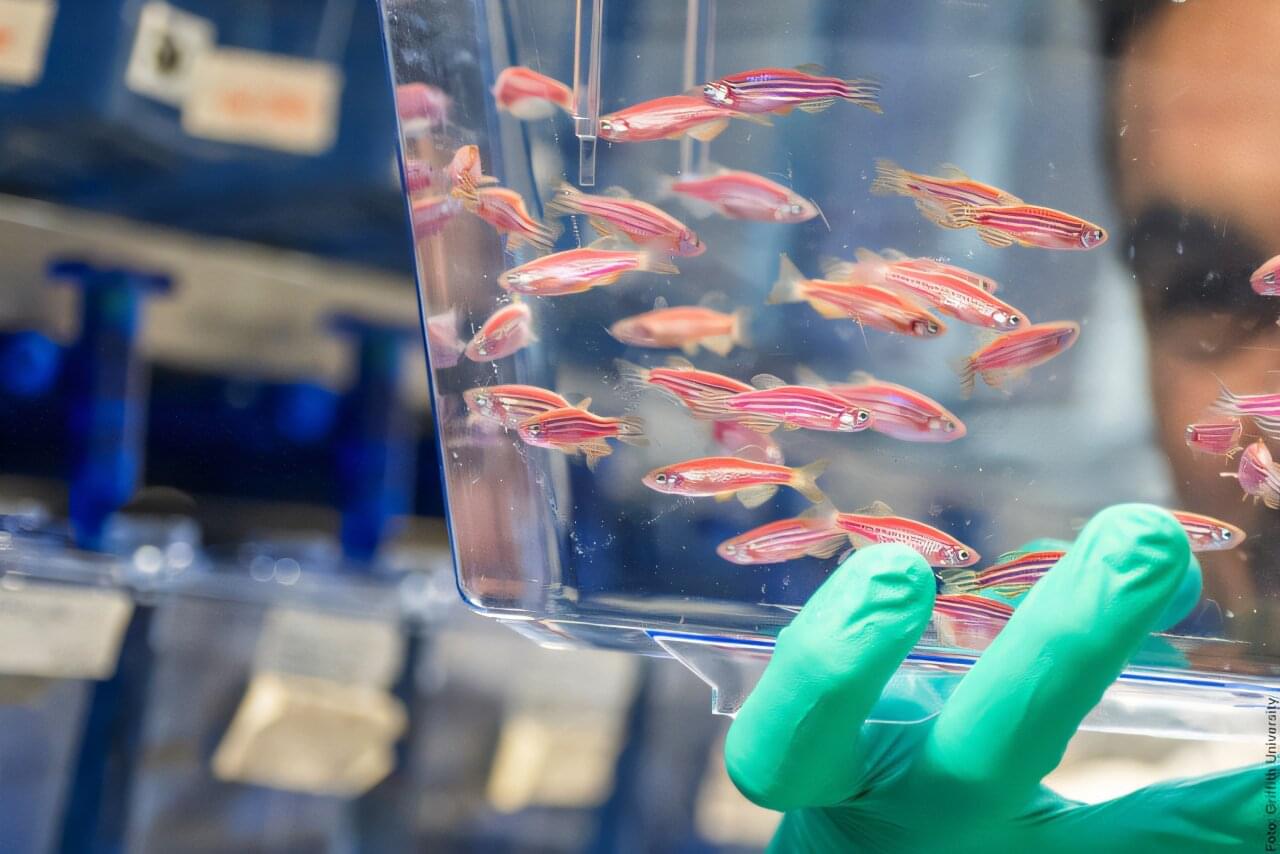
False alarm in newborn screening: How zebrafish can prevent unnecessary spinal muscular atrophy therapies
A positive newborn screening for spinal muscular atrophy (SMA) is currently considered a medical emergency. Without early treatment, severe disability or death in infancy are likely. However, research findings from Germany and Australia now show that in rare cases, a positive screening result can be a genetic false alarm. Researchers have discovered that functional tests in a zebrafish model may enable fast and reliable clinical decision-making in cases of unclear genetic findings.
The study “SMN1 variants identified by false positive SMA newborn screening tests: Therapeutic hurdles, and functional and epidemiological solutions” was published in the American Journal of Human Genetics and another study, “Clinical relevance of zebrafish for gene variants testing. Proof-of-principle with SMN1/SMA,” in EMBO Molecular Medicine. The collaborative research team was led by Professor Dr. Brunhilde Wirth, Director of the University of Cologne’s Institute of Human Genetics and Principal Investigator at the Center for Molecular Medicine Cologne (CMMC) and Dr. Jean Giacomotto from Griffith University’s Institute for Biomedicine and Glycomics, Brisbane, Australia.
The scientists examined two newborns—a girl from Germany and a boy from Australia—in whom routine screening initially failed to detect the SMN1 gene. A missing SMN1 gene is the main genetic trigger of SMA. This diagnosis would normally result in immediate treatment, as it would be assumed that the child’s life is in danger. However, further genetic analysis revealed a surprising finding: both children carried rare SMN1 variants that had not been detected by the screening test. It remains unclear whether these variants cause the disease.

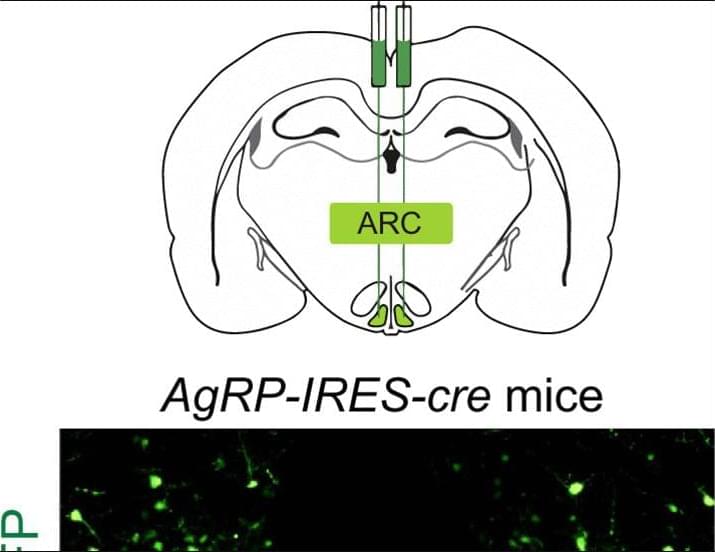
The TUB variant impairs leptin sensitivity and AgRP neuronal response, leading to obesity
What are the genetic origins of early-onset obesity?
Studying a cohort of young adults in China, researchers in Science TranslationalMedicine performed deep sequencing and identified a loss-of-function variant in the gene TUB that impairs sensitivity to leptin.
Rare human TUB variants impair leptin sensitivity through disruption of STAT3 activation, leading to hyperphagic obesity.
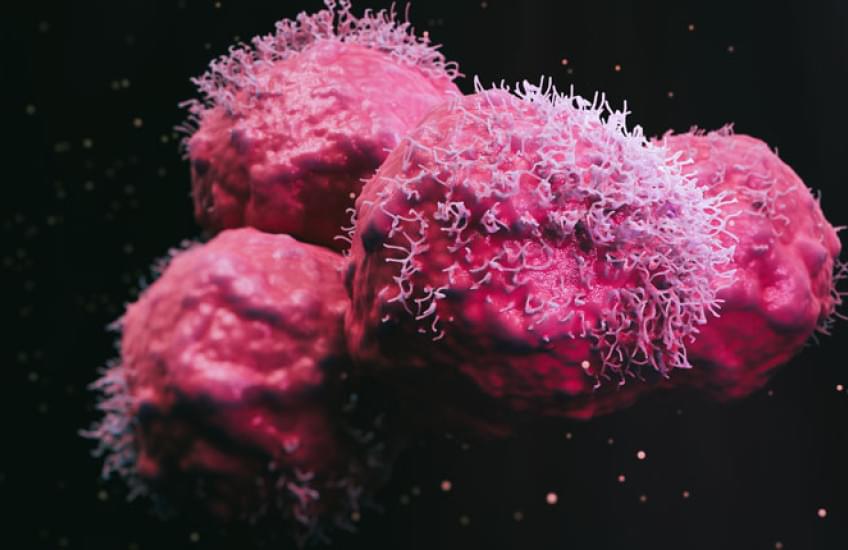
Cancer Outcomes Across Tumors Predicted by CCL3 Production by Neutrophils
Neutrophils are known as first responders to threatening infections and feature prominently in the microenvironment of tumors to resist cancer progression. Though neutrophils have been linked to the growth of multiple cancers, such as lung and breast, these cells can assume multiple functional states.
In a new study published in Cancer Cell titled, “ CCL3 is produced by aged neutrophils across cancers and promotes tumor growth,” researchers from Ludwig Institute for Cancer Research in Lausanne have discovered a gene expression program executed by tumor-associated neutrophils (TANs) and a corresponding biomarker that uniformly support cancer cell survival and tumor progression across human and murine tumors.
Results demonstrate that TANs characterized by this conserved genetic program are a central variable of the tumor microenvironment (TME) linked to cancer progression. The authors also identify an associated marker, CCL3, as key to supporting cancer growth.
Cell division spindles self-organize like active liquid crystals—a theory that holds up
When a cell divides, it performs a feat of microscopic choreography—duplicating its DNA and depositing it into two new cells. The spindle is the machinery behind that process: It latches onto chromosomes (where DNA is stored) and separates them so they can settle into their new homes. This tricky process can sometimes go wrong, causing infertility, genetic disorders, or cancer.
Scientists have a good understanding of what spindles are made of: long, thin rods called microtubules as well as a variety of associated motor proteins. However, how these microtubules interact and organize to guide the spindles’ function has remained a mystery.
One approach to understand how the spindle self-organizes is to treat it like an active liquid crystal. Liquid crystals, like spindles, are made up of elongated subunits. Unlike liquid crystals in LCD displays, which require an external electric field to reorient their subunits, spindles are active materials that generate forces internally.
Studies test whether gene-editing can fix high cholesterol. For now, take your medicine
WASHINGTON (AP) — Scientists are testing an entirely new way to fight heart disease: a gene-editing treatment that might offer a one-time fix for high cholesterol.
It’s very early stage research, tried in only a few dozen people so far. But gene-editing approaches being developed by two companies show hints that switching off certain genes could dramatically lower artery-clogging cholesterol, raising hopes of one day being able to prevent heart attacks without having to take pills.
“People want a fix, not a bandage,” said Dr. Luke Laffin, a preventive cardiologist at the Cleveland Clinic. After co-authoring a promising study published in the New England Journal of Medicine, he said he was flooded with queries about how to participate in the next clinical trial.
Cell Type-Specific Contributions of UBE3A to Angelman Syndrome Behavioral Phenotypes
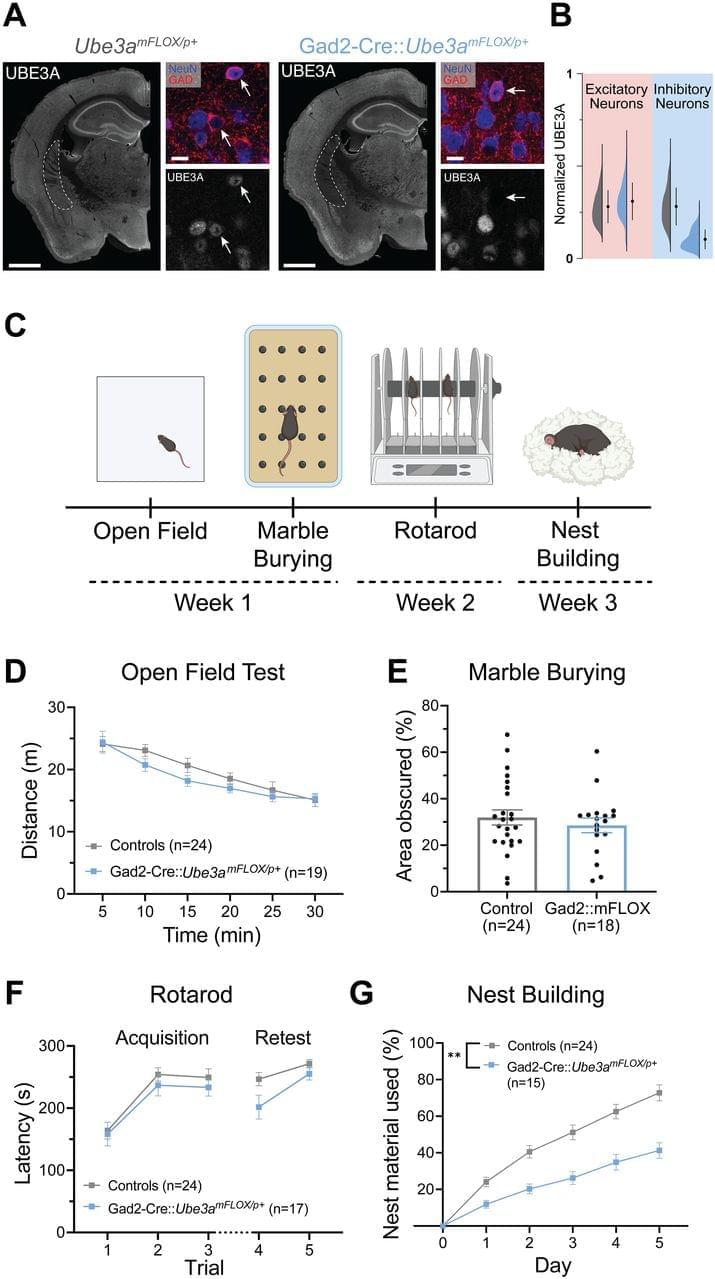
ENeuro: Ringelberg et al. identify a key role for excitatory neuron loss of UBE3A in motor, innate, and sleep behavioral phenotypes of Angelman syndrome model mice.
▶️
AS is a neurodevelopmental disorder with no disease-modifying treatment. However, clinical trials are currently underway using antisense oligonucleotides to unsilence the dormant paternal UBE3A allele, thereby normalizing UBE3A levels (Ionis: NCT05127226; Ultragenyx: NCT04259281). While this approach holds exciting promise and shows efficacy in mouse models (Meng et al., 2015; Milazzo et al., 2021), there is currently scant information regarding the key cell types or brain regions that require UBE3A reinstatement to mitigate core symptoms of AS. This holds particular importance, as effective biodistribution is a key concern in genetic therapies for CNS disorders (Roberts et al., 2020; Jafar-Nejad et al., 2021; Ling et al., 2023), and suboptimal targeting of necessary cell classes could hamper success. Moreover, mouse models of AS require early postnatal Ube3a reinstatement to achieve optimal phenotypic recovery (Silva-Santos et al., 2015; Sonzogni et al., 2020); early intervention could be difficult to achieve in the patient population without a corresponding early diagnosis, meaning many AS individuals are likely beyond the critical window to maximally benefit from UBE3A reinstatement-based therapies. Therefore, additional work is needed to better understand how loss of UBE3A leads to symptoms, as these insights will aid both in understanding the cell types that must be targeted for optimal genetic interventions and in developing alternative therapeutic options.
Our laboratory’s previous work identified an outsized role of GABAergic loss of UBE3A in hyperexcitability phenotypes. GABAergic loss of UBE3A drives increased delta power on cortical EEG (Judson et al., 2016), a phenotype that correlates with the severity of a range of symptoms in AS individuals (Hipp et al., 2021; Ostrowski et al., 2021). Further, mice with Ube3a deleted from GABAergic neurons show decreased threshold to chemically and acoustically driven seizures, and they also exhibit spontaneous behavioral seizures, a phenotype not observed in AS model mice on a C57BL/6J background (Judson et al., 2016; Gu et al., 2019). These data forewarn that UBE3A reinstatement in a manner biased to glutamatergic neurons could potentially worsen epilepsy-related symptoms and highlight the importance of studying the neuronal populations regulating other behaviors.
Based on the exaggerated role of GABAergic neurons in AS seizure phenotypes, we predicted that GABAergic deletion of Ube3a would underlie a broad range of behavioral phenotypes in AS mice. In the present study, we instead found a larger role of Ube3a deletion from glutamatergic neurons in motor coordination, measured by rotarod and open field behavior, and innate species-specific behaviors such as marble burying. Furthermore, glutamatergic loss of UBE3A appears to mediate alterations in sleep patterning and induces some sleep fragmentation, while UBE3A loss from GABAergic neurons only caused fragmented sleep. Interestingly, glutamatergic reinstatement of Ube3a also rescued the decreased REM sleep observed in AS mice, as estimated by the PiezoSleep system. While this study identified some roles of GABAergic neurons in nest building behavior and sleep fragmentation, our data largely suggest a divergence of the neural circuitry underlying the motor, innate behavior, and sleep phenotypes of AS mice from the circuitry responsible for seizure susceptibility and cortical EEG patterns.

Engineering chimeric antigen receptor CD4 T cells for Alzheimer’s disease
Recent advancements in immunotherapy have led to the first successful application of chimeric antigen receptor (CAR) T-cell therapy in treating neurodegenerative diseases, specifically Alzheimer’s disease. In a study conducted by researchers at Washington University in St. Louis and the Weizmann Institute of Science, T-cells were genetically engineered to recognize and target toxic beta-amyloid plaques. When tested on mouse models, three injections of these modified cells resulted in a significant reduction of protein aggregates within just ten days of the final administration. Beyond plaque clearance, the treatment successfully mitigated neuroinflammation, as evidenced by decreased microglial and astrocytic activity. These findings demonstrate the potential of CAR-T technology to rapidly clear pathological protein deposits and restore nervous tissue function, offering a promising new frontier for the treatment of Alzheimer’s and other proteinopathies.
Alzheimer’s disease (AD) is the prevailing cause of age-associated dementia worldwide. Current standard of care relies on antibody-based immunotherapy. However, antibody-based approaches carry risks for patients, and their effects on cognition are marginal. Increasing evidence suggests that T cells contribute to AD onset and progression. Unlike the cytotoxic effects of CD8+ cells, CD4+ T cells capable of regulating inflammation show promise in reducing pathology and improving cognitive outcomes in mouse models of AD and in aging. Here, we sought to exploit the beneficial properties of CD4+ T cells while circumventing the need for TCR and peptide-MHC antigen discovery, thereby providing a potential universal therapeutic approach. To achieve this, we engineered CD4+ T cells with chimeric antigen receptors (CARs) targeting fibrillar forms of aggregated amyloid-β. Our findings demonstrate that optimized CAR-T cells can alter amyloid deposition in the dura and reduce parenchymal pathology in the brain. Furthermore, we observed that CAR-T treatment promotes the expansion and recruitment of endogenous CD4+ T cells into the brain parenchyma and leptomeninges. In summary, we established the feasibility of amyloid plaque-specific CAR-T cells as a potential therapeutic avenue for AD. These findings highlight the potential of CD4+ CAR-T therapy not only to modify amyloid pathology but also to reshape the immune landscape of the CNS, paving the way for future development of cellular immunotherapies for neurodegenerative disease.
Keywords: Alzheimer’s disease; CAR T cells; T cell; chimeric antigen receptors; neurodegeneration.

A giant tortoise, extinct for over a century, has reappeared alive after several failed expeditions, reviving a historic plan to save the species, a symbol of evolution
Genetic sleuthing has now confirmed that she belongs to the Fernandina Island Galápagos giant tortoise, Chelonoidis phantasticus, a lineage thought lost since a lone male was collected in 1906.
Only two individuals of this lineage have ever been found, the museum specimen from the early twentieth century and Fernanda. To make sure she was not a stray tortoise washed in from another island, researchers sequenced her entire genome and compared it with DNA extracted from the century-old male and from all other living Galápagos tortoise species.
The analyses showed that Fernanda and the museum male form their own distinct branch, separate from the rest of the archipelago’s giants.